 PrintSheriff
04 — Attention
What the model looks at
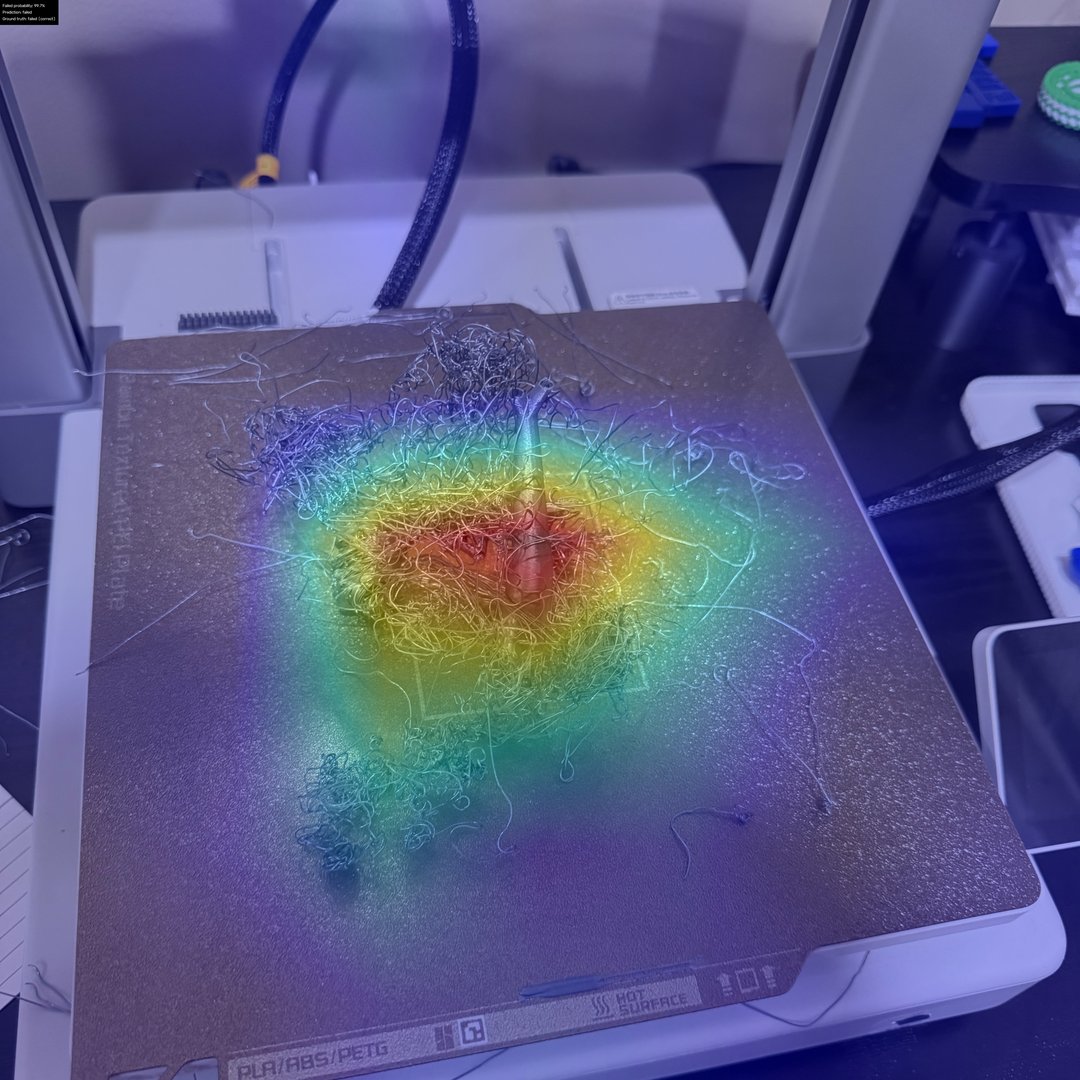
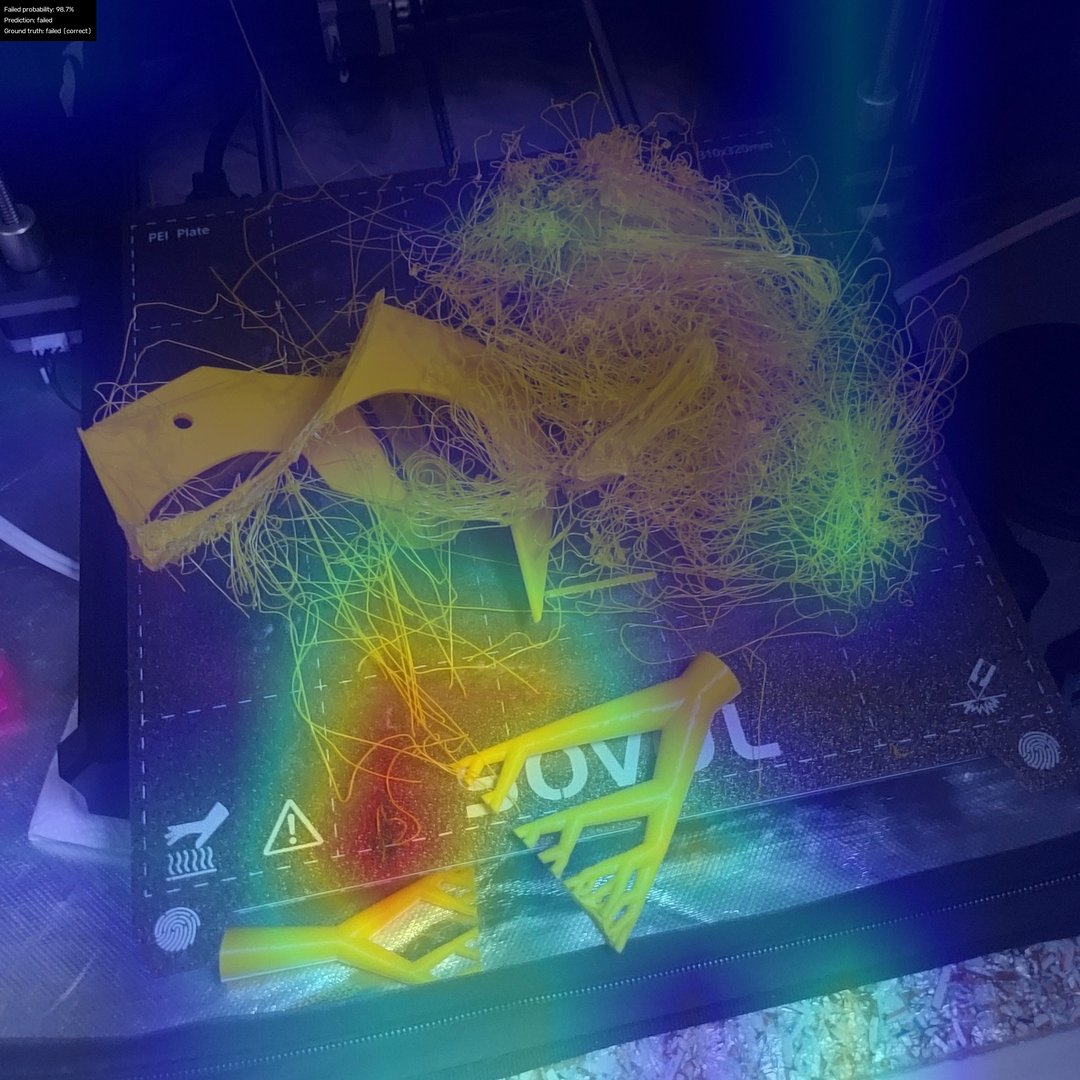
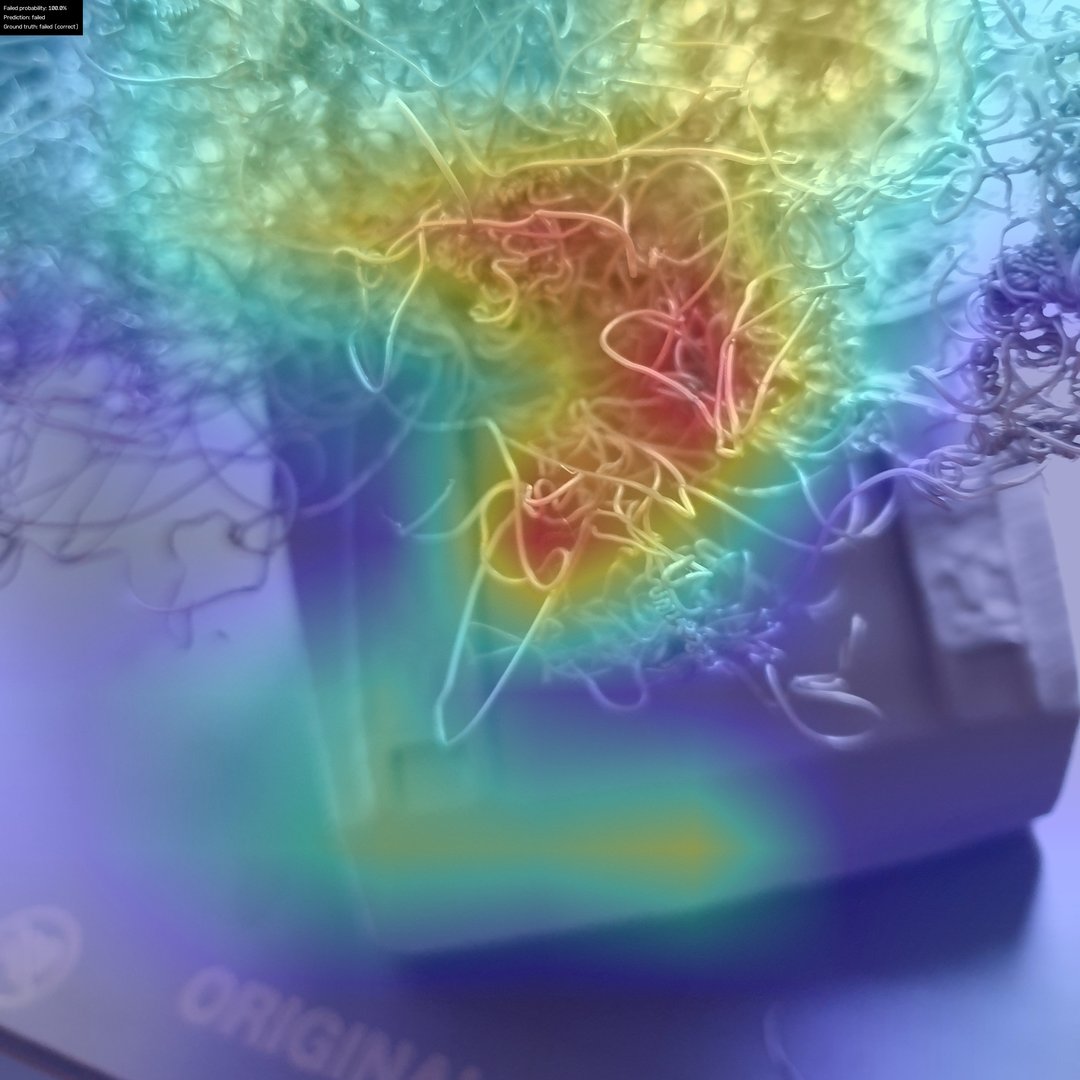
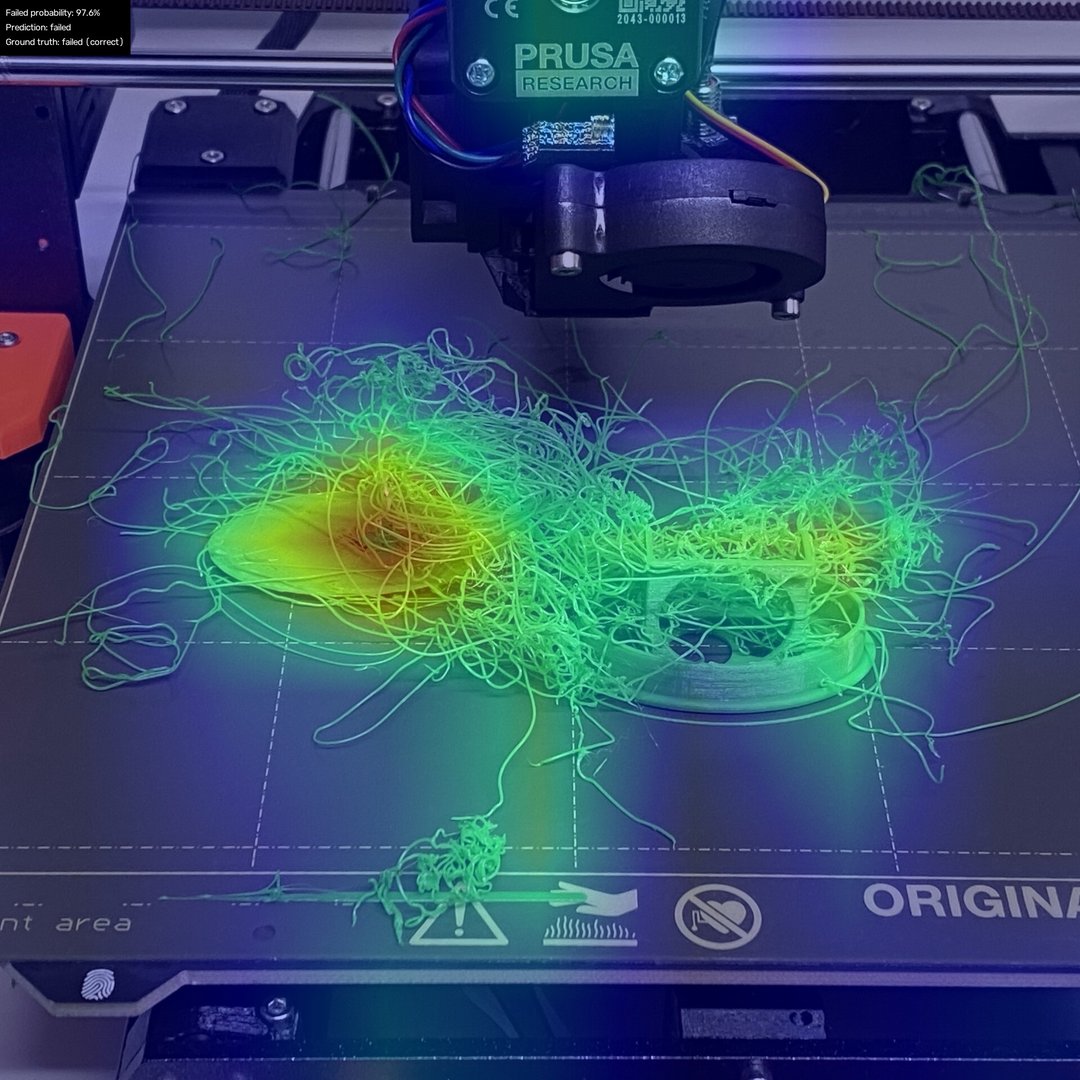
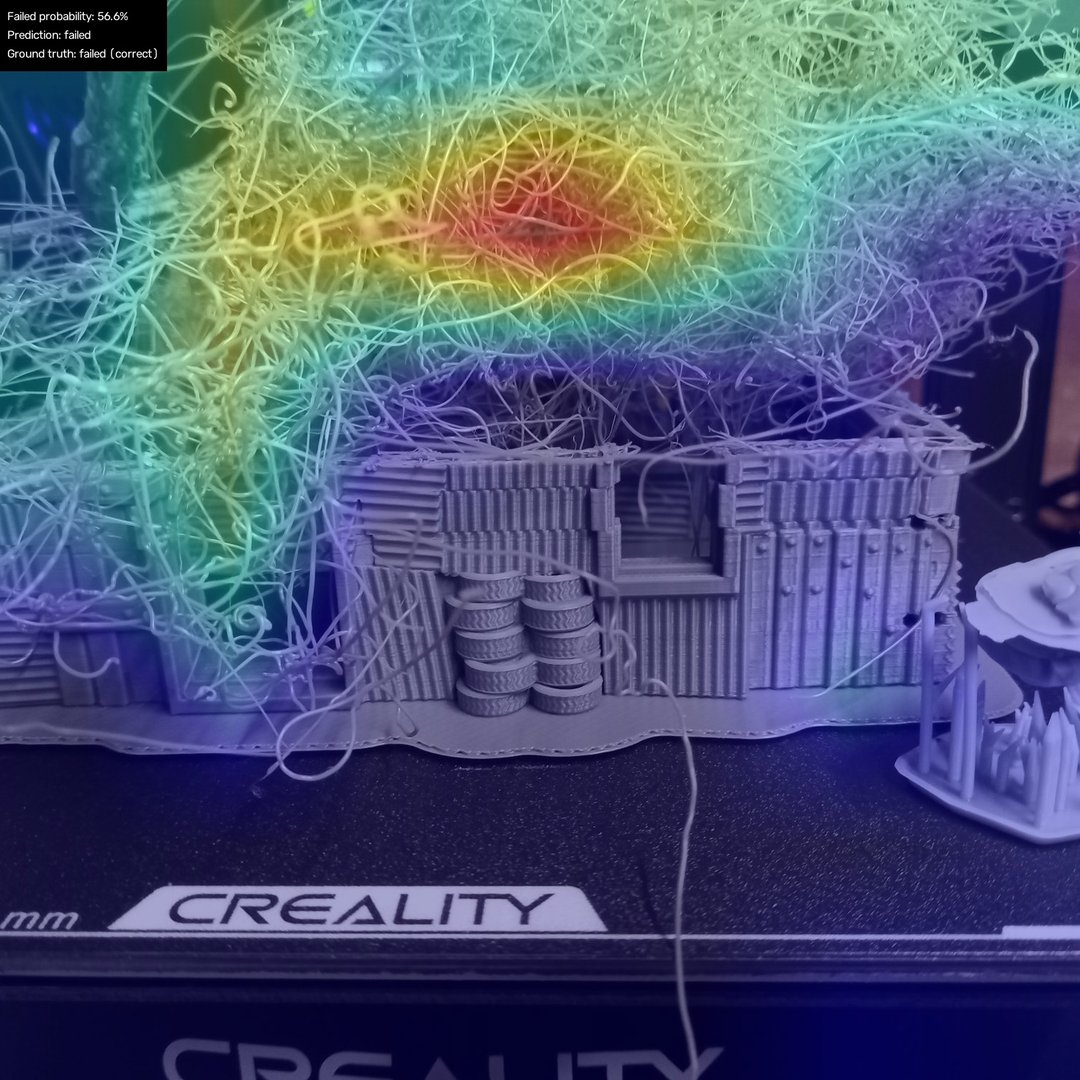
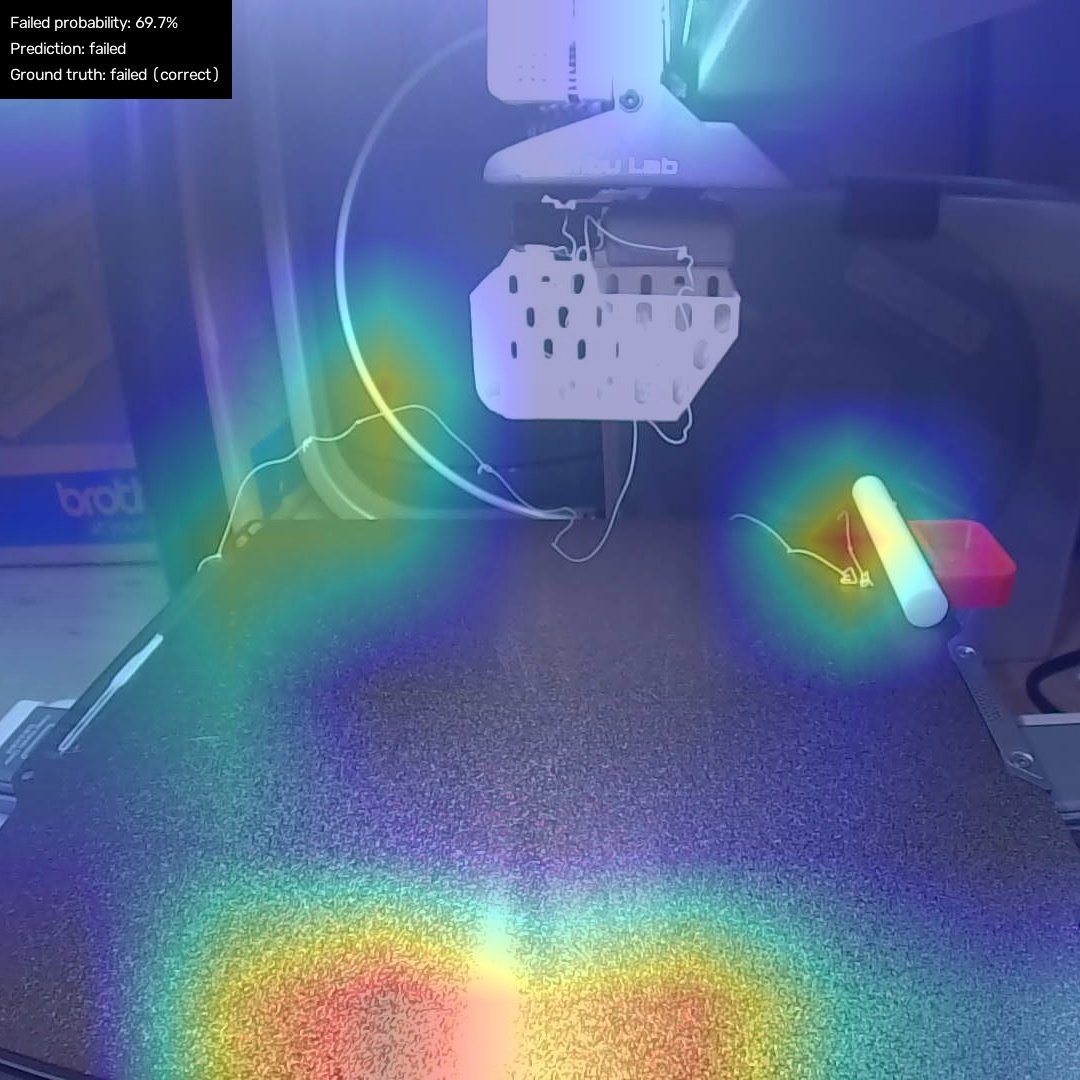
The attention map highlights the regions that pushed the “failed” score up. Warmer, more opaque areas contributed more; cooler, more transparent areas contributed less.
Each sample carries its probability, prediction and ground truth burned into the top-left corner, so the outcome is readable without interpreting the heat colours.
Where it breaks down
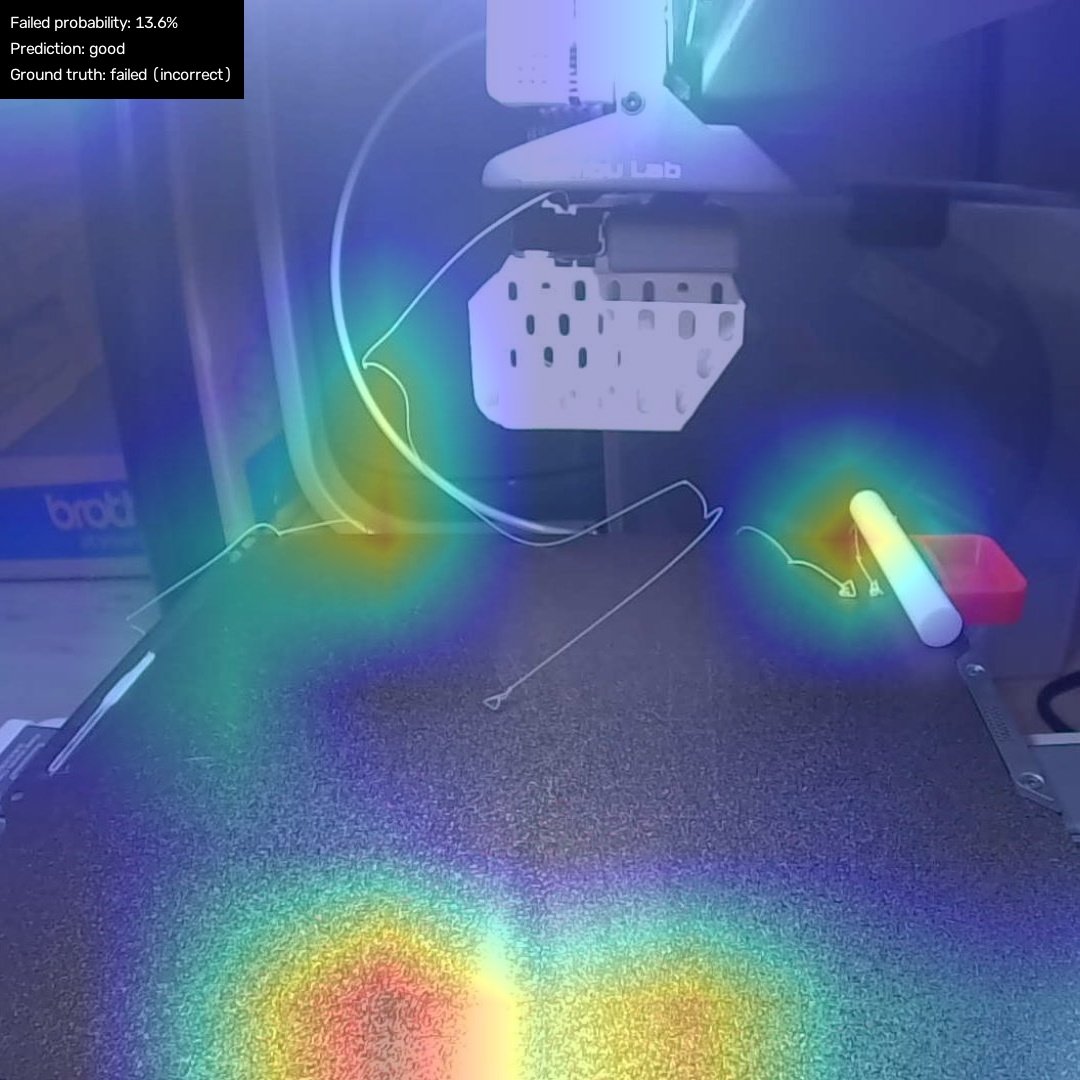
Early-stage failures flip between adjacent frames like this, which is exactly why the plugin never alerts on a single frame. It waits for 3 of the last 5 to cross the threshold — see the front page overview.